DnSpy is a c# reverse engineering tool which helped me to decompile a c# assembly and debug it
Problem I am trying to solve:
I Was having an issue with a .Net Windows Application exe throughing error message when trying to open it. I have an exe, and all dll’s related to the project and a local database instance whose connectionstring is specified in a ini file. Unfortunately I dont have access to code base so that I can debug it using Visual Studio. So I was searching for options to actually find out what the issue was.
I tried following approaches:
- Decompile the dll’s using dotPeek( jetbrains dotpeek), JustCompile and then create the project in visual studio but that failed.
- Another option can be using Visual Studio + dotPeek( as symbol server), Even this is not successful because I am not able to attach process in visual studio, because it is failing in the load it self.
So I am actually looking for a reverse enginerring tool which can acts as a c# disassembler
Then I came accross a called “dnSpy”.
dnSpy - A Fantastic Decompiler, Debugger and Editor:
What? does this tool does all these things?
Yes I am able to decompile my .Net dlls and then debug them and finally I am also able to edit decompiled Dll’s and run them.
This is a list of capabilities that were mentioned in their website https://github.com/0xd4d/dnSpy
So I can say that “dnSpy” is a must have tool in a .Net developers toolkit.
Debugger:
- Debug .NET Framework, .NET Core and Unity game assemblies, no source code required
- Set breakpoints and step into any assembly
- Locals, watch, autos windows
- Variables windows supports saving variables (eg. decrypted byte arrays) to disk or view them in the hex editor (memory window)
- Object IDs
- Multiple processes can be debugged at the same time
- Break on module load
- Tracepoints and conditional breakpoints
- Export/import breakpoints and tracepoints
- Call stack, threads, modules, processes windows
- Break on thrown exceptions (1st chance)
- Variables windows support evaluating C# / Visual Basic expressions
- Dynamic modules can be debugged (but not dynamic methods due to CLR limitations)
- Output window logs various debugging events, and it shows timestamps by default :)
- Assemblies that decrypt themselves at runtime can be debugged, dnSpy will use the in-memory image. You can also force dnSpy to always use in-memory images instead of disk files.
- Public API, you can write an extension or use the C# Interactive window to control the debugger
Assembly Editor:
- All metadata can be edited
- Edit methods and classes in C# or Visual Basic with IntelliSense, no source code required
- Add new methods, classes or members in C# or Visual Basic
- IL editor for low level IL method body editing
- Low level metadata tables can be edited. This uses the hex editor internally.
Hex Editor:
- Click on an address in the decompiled code to go to its IL code in the hex editor
- Reverse of above, press F12 in an IL body in the hex editor to go to the decompiled code or other high level representation of the bits. It’s great to find out which statement a patch modified.
- Highlights .NET metadata structures and PE structures
- Tooltips shows more info about the selected .NET metadata / PE field
- Go to position, file, RVA
- Go to .NET metadata token, method body, #Blob / #Strings / #US heap offset or #GUID heap index
- Follow references (Ctrl+F12)
Others:
- BAML decompiler
- Blue, light and dark themes (and a dark high contrast theme)
- Bookmarks
- C# Interactive window can be used to script dnSpy
- Search assemblies for classes, methods, strings etc
- Analyze class and method usage, find callers etc
- Multiple tabs and tab groups
- References are highlighted, use Tab / Shift+Tab to move to next reference
- Go to entry point and module initializer commands
- Go to metadata token or metadata row commands
- Code tooltips (C# and Visual Basic)
- Export to project
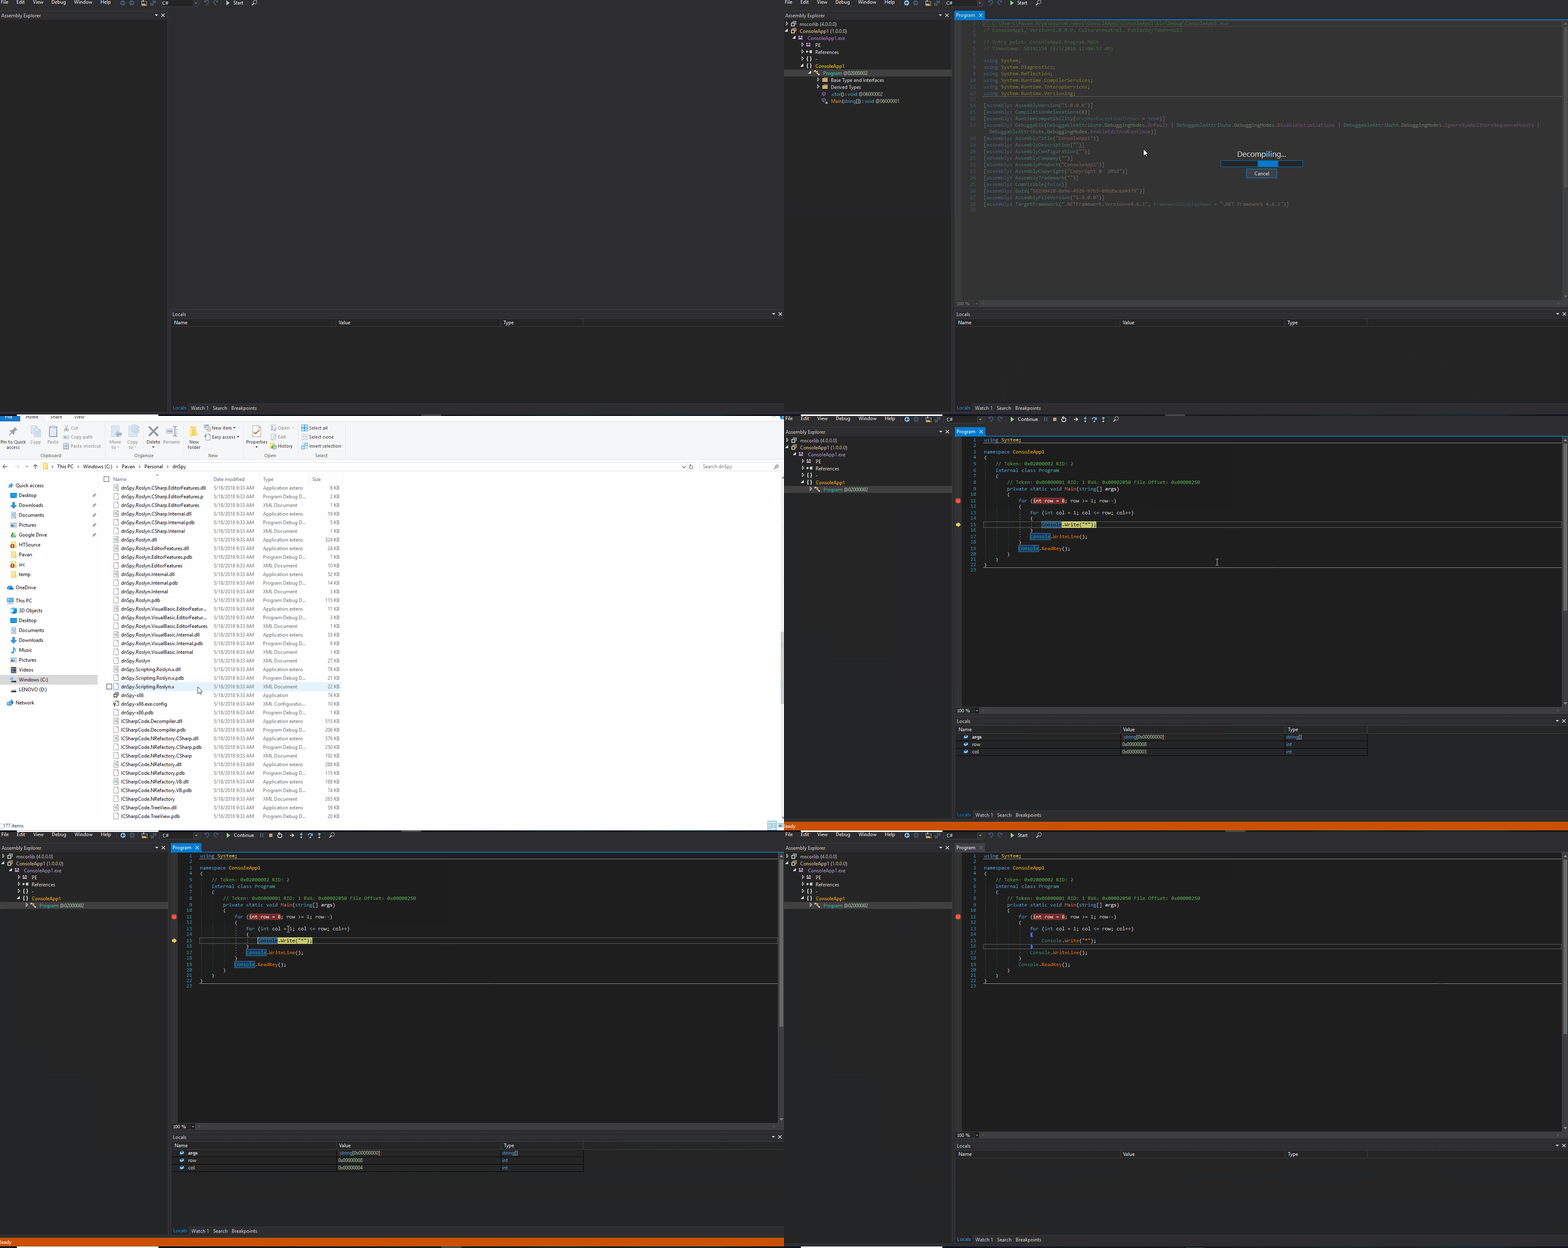
Debugging a simple application using dnSpy:
Download latest release of dnSpy zip file from https://github.com/0xd4d/dnSpy/releases
Once it is downloaded, unzip it and go to the folder and there we have an exe with name “dnSpy”. Double click and open it
I am trying to debug a small console application exe.

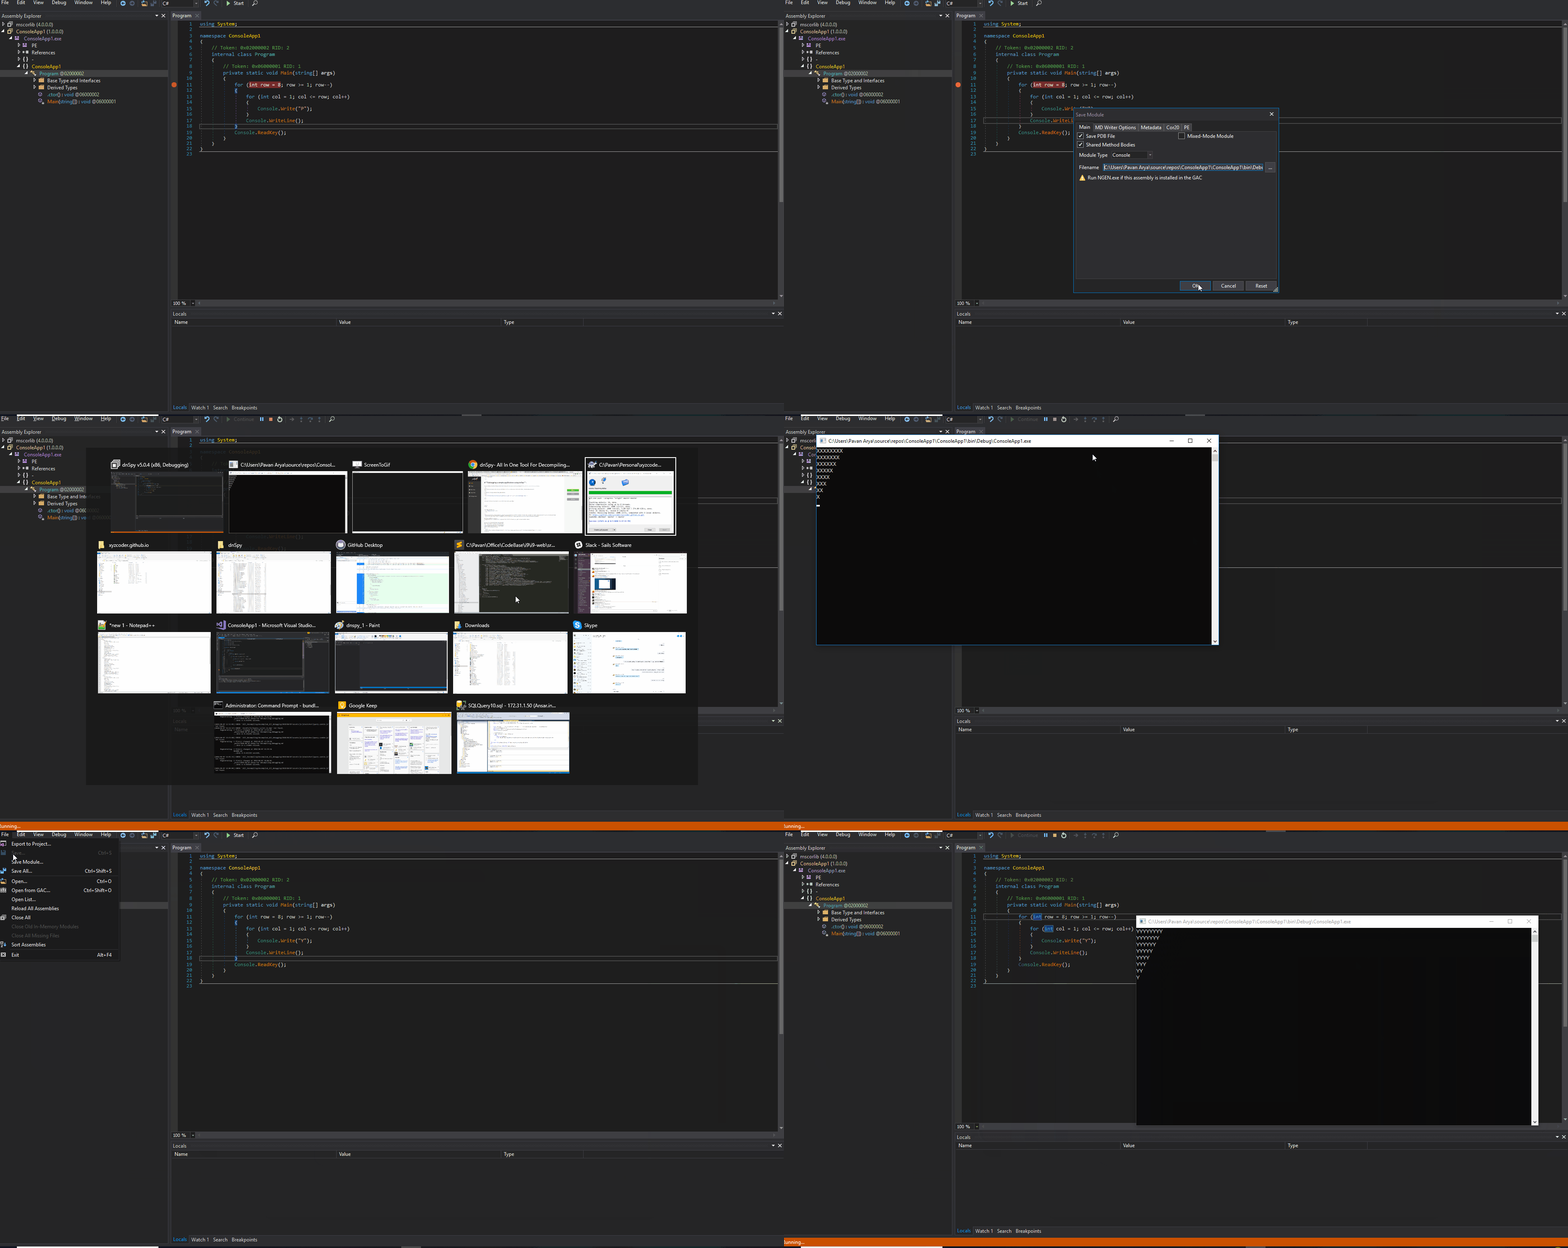
Editing a simple application dll/exe using dnSpy:

Keywords: reverse engineering tools, c# decompiler, dot net decompiler, c# disassembler, c# reverse engineering
Thanks, Pavan
